We often associate analytics with two main issues: the difficulty of understanding the metrics and the time-consuming process of getting the necessary data.
Did you know that you can set up a daily, εβδομαδιαίος, or monthly report that is automatically sent to your inbox? And that you can pick up the metrics you WANT to track and customize the report so that it becomes easy to understand?
It’ll only take an hour of your time to set up the report once, and you will never spend more than five minutes a day on analytics. Εδώ είναι πώς να το κάνουμε.
What Data You Should Track
When studying a report, analysts usually look for the number of visits, προβολές σελίδας, referrers, και τα λοιπα. But those data do not say anything about the performance of the store.
You can have thousands of visitors per day and no orders. Or you advertise on five advertising channels, but you do not know who the most generous customers are, and where you are spending your money for nothing.
To evaluate the cost-effectiveness of an online store, you need to look at the following data:
- total revenue
- συναλλαγές
- μέση αξία της παραγγελίας
- average revenue per session
- average revenue per user
- προϊόντα
- revenue per traffic source
- e-commerce conversion rate per traffic source
- revenue per product
In order to regularly receive relevant data on these indicators, it’s not necessary to spend a lot of time on the statistical analysis. The only thing you need to do is to set up a summary report once.
That page will contain all the data you need and regularly update them. One look, and you’ll know all the sales of your store in a day, μήνας, or another period.
Report creation does not replace statistical systems, but it does facilitate your daily work. If you can see from the summary that your store is doing great, there is no need to log in. A deep analysis of the data will determine if something went wrong, and the daily report can tell you that.
Your Dashboard in Google Analytics
Once you have configured a sales summary report with Google Analytics, you can get all the information on what is happening with the shop on a daily basis in a couple of minutes. No need to wander through the reports and build segments. All the data are collected on a single page.
Επιπλέον, you can schedule how often reports are sent to your inbox: καθημερινά, εβδομαδιαίος, ή μηνιαία.
This will also reduce the time for the daily statistics authorization systems. Every morning you can get a report on the results of the previous day; every Monday, a report for the previous week; and on the first day of each month, you can expect a full report with the data for the previous month.
You can customize any summary as you wish, or use the one that we offer:

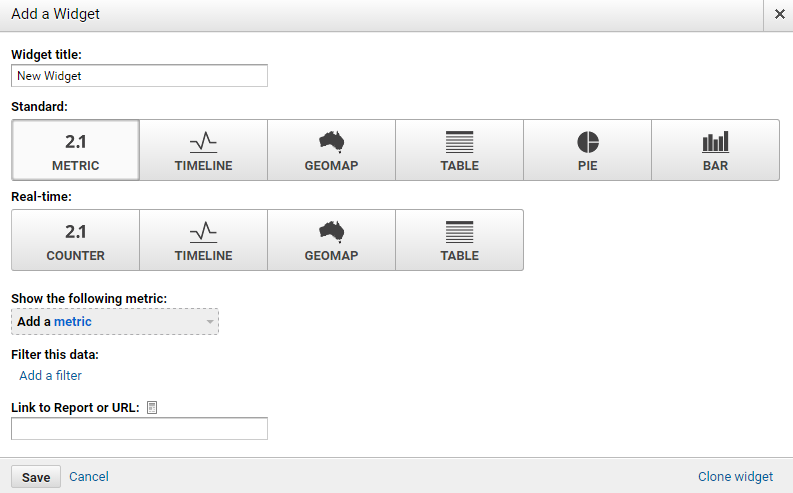
Widgets
Each summary includes widgets, which are individually configurable blocks. The maximum number of widgets available in one summary is 12. In our example, we use them all. The choice of widgets is based on the principle of maximum utility.
Widgets are placed in columns. There are six accommodation options available for widgets in the summary.

There are two kinds of widgets:
- standard widgets, reflecting data for the selected time interval; και
- widgets that show data in real time. These work well for regular ongoing monitoring.
The widgets are categorized into types:
- metric
- timeline
- geomap
- τραπέζι
- pie
- μπαρ
We picked the following widgets for the report:
1. Συνεδρίες

This metric shows the total number of site visits for a specific period.
2. Τα συνολικά έσοδα

As you can see in the picture, this widget shows the total revenue for a specific period.
3. Average Revenue per User

This widget shows the average amount of revenue per user.
4. Συναλλαγές
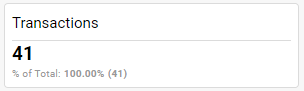
Πάλι, it’s clear that the widget shows the number of transactions for a specific period.
5. E-commerce Conversion Rate

This is your conversion rate – the number of transactions divided by the number of visits.
6. Μέση αξία παραγγελίας

This widget displays the average order value.
7. Ποσότητα

This widget displays the number of sold products.
8. Average Revenue per Session

This widget shows the average revenue that one visit brings (δηλ. the total revenue divided by the number of visits).
9. Προϊόντα

This table shows the number of sold products and their revenue.
10. Εσοδα / Πηγές επισκεψιμότητας

This widget tells you where your visitors come from and how much money they spend in your store.
11. Εσοδα / Channels

This widget shows you the average order value for different sales channels.
12. E-commerce Conversion Rate / Πηγές επισκεψιμότητας

Find out the number of transactions from every traffic source and their conversion rate.
Setting Up the Report for Your Online Store
To make a similar summary that contains all the data you need, κάνετε τα εξής:
- Add Google Analytics to your store.
- Configure the store to e-commerce tracking data.
Μάθε περισσότερα: Ο οδηγός του αρχαρίου για το Google Analytics για Καταστήματα ηλεκτρονικού εμπορίου
When you’re done with steps 1 και 2, log in to Google Analytics and click on this link.
Then you can choose the account and the view of your report.

Now you can open the report whenever you need it.
It’s always there on your Dashboards -> Private -> Εμπορικός. To create a report for a certain period, choose the dates in the top right corner. If you want to edit the widgets, just click on them.

Sending Automatic Reports to Your Inbox
You can export the report, and send it to yourself or to a colleague.

But the best part is that Google Analytics can send it to you automatically – daily, εβδομαδιαίος, μηνιαίος, or only once. You just need to set up the frequency and type in your email address.
Using advanced options, you can also limit the time during which you’ll get the reports – from one to 12 μήνες.


- Didn’t Migrate to Google Analytics 4? Here Is Why You Need to Do That Now
- Του Google My Business 360: Πώς να κερδίσετε έναν τοπικό διαγωνισμό
- Ένας εύκολος τρόπος για να κερδίσετε περισσότερα στο Google My Business
- A Complete Guide to Google Analytics for Ecommerce
- Πώς να προσθέσετε το Google Analytics για Online Store σας
- How to Set Up Daily Ecommerce Reports in GA
- Τι είναι ο Διαχειριστής ετικετών Google
- How To Use Google Tag Manager
- Τι είναι το Google Search Console
- How To Set Up and Use Google Search Console
- Τομείς Google: Τι είναι αυτό, and How Does It Work?
- Gmail: Πώς να γράφετε και να διαχειρίζεστε μηνύματα ηλεκτρονικού ταχυδρομείου σαν επαγγελματίας
- The Ultimate Guide to Google Docs