Imagine that a pilot would have to control a plane without a dashboard. Most likely, it’d be a mess.
The same is true for online sellers. To decide on your next move, you need to understand what’s going on in your online store:
- Where your customers come from
- How much they spend
- What products are most popular
- How your promotions perform.
Your Ecwid store can provide that data. The more you track, the more you know — and the more you can achieve. Data reveals strengths and weaknesses, forecasts pitfalls, and helps you allocate your budget wisely.
Just like professional pilots, you can conveniently control your data on a dashboard. Go to My Sales → Reports to get an overview of all the available tools and to set up reports that are relevant to your specific business.
Vital Metrics
Start tracking your online store metrics after the store opening. You don’t have to set anything up, the data is collected automatically.
Automated reports and sales analytics
How are your sales doing? A quick trip to Control Panel → Sales → Reports will let you find out immediately.
On the top of this page, click Set up.
After you install the app, click Open, and you’ll see a
- Visitors
- Revenue
- Conversion Rate
- Orders
You can display those stats for the day, month, or any other period. With this intuitive page, you’ll always keep your fingers on the pulse of your business and be able to track positive and negative trends.
The basic metrics are available on the Free plan.

If you want more data, extended stats are available:
- Items per Order
- Revenue per Order
- Visits Until Purchase
- Time to Purchase
- Top Products
- Top Categories
- Top Locations
- Order Status
- Traffic Sources
- Conversion Rate by Channel
- Customer Acquisition Cost for Ads
- Top Keywords
These metrics and more will give you a better picture and let you plan your marketing campaigns, allocate your budget, and turn down unprofitable sales channels.
The advanced analytics are available on all Ecwid paid plans.
Real-time sales tracking
It’s possible to track data even without your computer. With the Ecwid mobile app, you can get your sales data on your iPhone, iPad, or Android device.
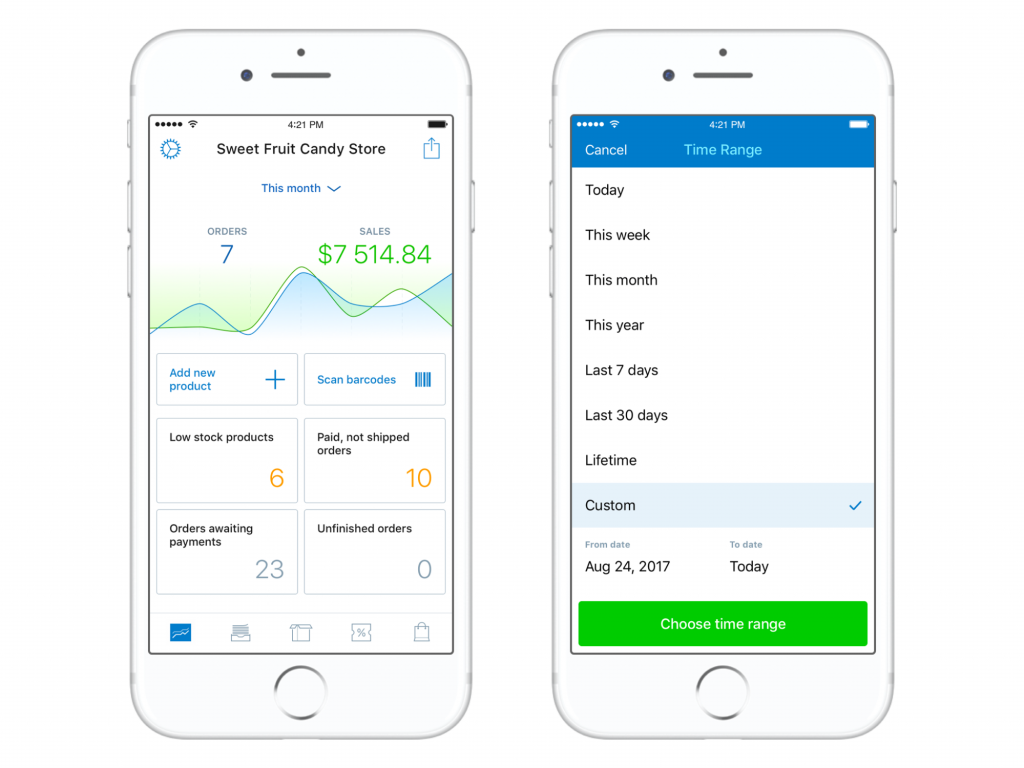
To install the app, go to Sales → Reports and follow the setup steps.

If you are already using the app, you simply won’t see this block on your reports dashboard.
Our app is far more than an analytic tool. You can create and edit orders, run and pause promotions, print invoices, and get help with your store.
Start a
Learn more: How to Run a Store from Your Smartphone
Deep Analytics
Google Analytics is the most popular free analytic tool that helps thousands of online merchants scale and adjust their sales. It provides a lot of customer data: who they are, where they come from, what exactly they do in a store.
These features make Google Analytics your
- Sales Funnels
— You can find out quickly whether your site’s checkout process is effective with goal tracking and funnel visualizations. - Visitor Engagement
— Measure visitor engagement and see how much time a visitor spends on your site and which pages they check out. - Historical Benchmarking
— With GA, you can examine how your acquisition channels performed this year versus last year.
To get started, create a Google Analytics account and connect it to your Ecwid store:
- Click Set Up Google Analytics on your Sales → Reports page.
- Add your Google Analytics Web Property ID (How to get your ID).

If you are going to run paid search ads with Google Adwords, enable the Remarketing feature. You’ll be able to advertise to your store visitors: return those who left without a purchase or remind your existing customers of your store.

That’s it! You’re done setting up. The stats will start generating during the next 24 hours. You can track them in your Google Analytics account.
Learn more:
- The Beginner’s Guide To Google Analytics For
E-commerce Stores - How to Add Google Analytics to Your Online Store
Extended Options
A number of apps in the Ecwid App Market will simplify stats management for you and save you time. All Ecwid merchants on paid plans have access to the App Market.
Visitor recordings and heat maps
You can see what’s going on in your store from a customer point of view, just like in a movie. Lucky Orange can track anonymous sessions of your actual customers so that you see how they browse, what they click on, and where they leave.
Another comprehensive way to examine your stats is heat maps. Such a map aggregates a lot of customer actions (clicks) and shows you where they click the most, as if you are looking at your website through

Using heat maps allows you to understand if your website design, copy, and photography perform well and to adjust those things based on customer behavior, not guesses.
Lucky Orange offers these features and more for
Scheduled reports in your inbox
Analytics take time, but you can save some by scheduling automated daily, weekly, or monthly reports that will be sent to your inbox. There are at least two ways to do that:
- Set up automated reports in Google Analytics. It’s easier than it may sound.
- Use Squiz Reports. Those are beautiful reports that require less effort to get started with.

Simply install the Squiz Reports app
Sales tracking via Facebook Messenger and Telegram
Statiny Chatbot is a bot that replies to your commands with fresh data from your online store.
You can ask a bot to set up a schedule and send you automated daily reports. This bot is of great help for those merchants who need to share their stats with admins/managers/marketers because it’s possible to add several owners.

This app has a free plan and a free
***
The Reports page in your Ecwid store was built to make it easier for you to manage your analytics tools and make sense of all the data.
Keep checking it out to see what tools you have installed and what else you can try for working with your store insights.

- 8 New Ecwid Tools You Might’ve Missed
- 10 Easy Ways to Update Your Ecwid Store
- 10 New Ecwid Tools to Up Your Revenue, Shipping, Payment, Reach, and More
- 10 New Ecwid Tools to Upgrade Your Social Selling, Payments, and Store Design
- 9 Ecwid Updates That Make Running an Online Store a Breeze
- 10 Powerful Ecwid Updates to Manage Your Store
- 20 Awesome Ecwid Updates That Will Save You Hours of Work
- 15+ Ecwid Updates for
Time- andCost-Effective Store Management - Online Store Analytics: Managing Reports and Sales Stats in Ecwid
- Why Booking Online is Important (and How to Add It to Your Ecwid Store)
- 15+ Ecwid Updates That Simplify the Life of a Busy Business Owner
- 10+ Ecwid Updates You Don’t Want to Miss
- 10 Ecwid Updates for an Exceptionally Powerful Online Store